Each year the Steuben County Soil and Water Conservation District (SWCD), in conjunction with the Indiana Conservation Partnership (ICP), completes a spring tillage transect survey. The tillage transect is a windshield survey that is conducted in June or July to collect information on tillage practices, residue cover, and the crops planted from 280 points across the county. Data gathered from the survey is used to track cropland use, conservation cropping systems, cover crop adoption, and crop residue, which can be used to estimate soil erosion rates.
The increased demand for Indiana’s row crop production, coupled with the ICP’s focus on soil health management systems, makes tracking trends in cropping systems an important and valuable activity, especially in the face of reports on agriculture’s role in the Gulf Hypoxia and Great Lakes algal bloom issues. Tillage transects are a tool that can be used to see how well our coordinated efforts toward conservation soil health management systems are adopted by Hoosier producers.
In addition to the data gathered, the tillage transect allows the opportunity for the SWCD to observe and discuss the conditions, needs, and accomplishments related to the natural resources of Steuben County. Finding conservation practices that reduce farm inputs and help the bottom line, in addition to improving soil health and water quality, is the key to adoption.
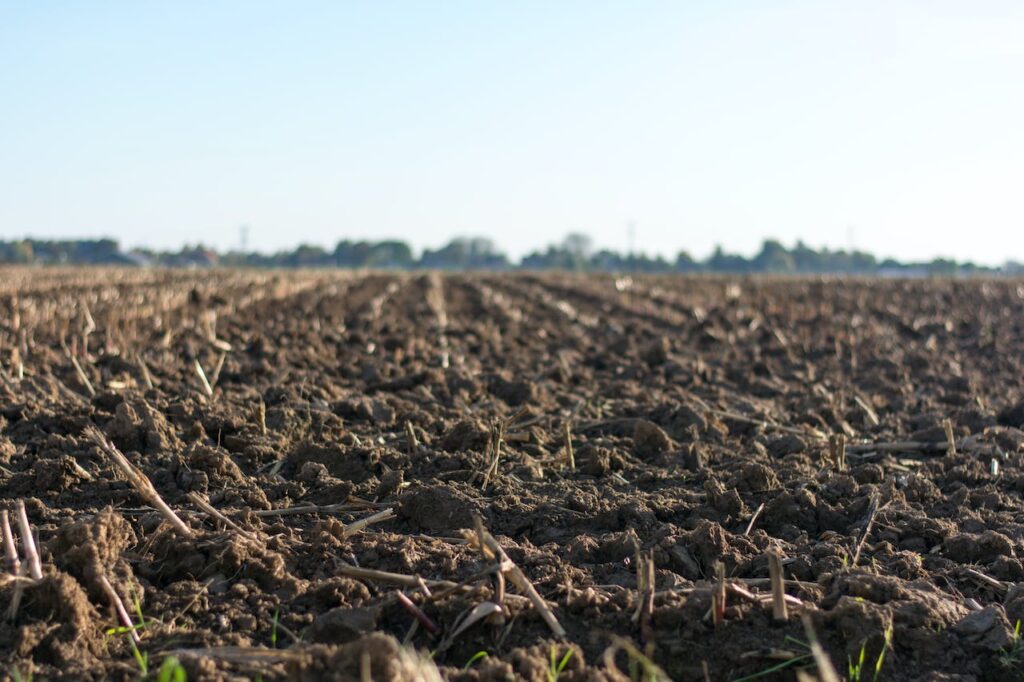
Reduced tillage system. Note the amount of residue left on the ground.
Photo Courtesy of Pexels.
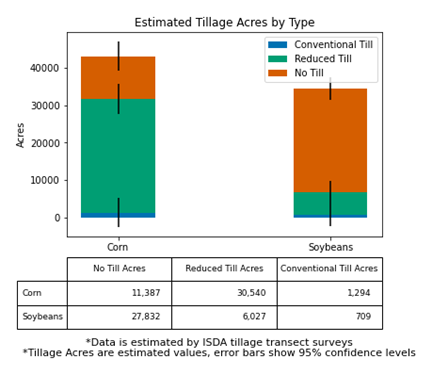
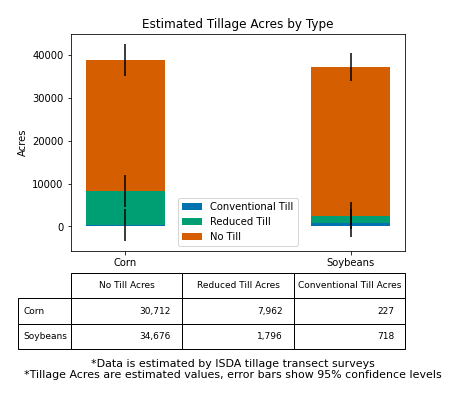
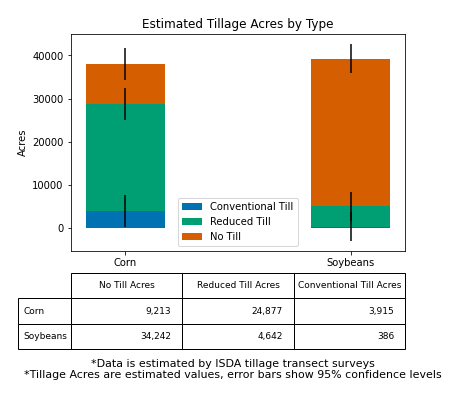
To discuss the transect data, we will first define a few tillage terms. Conventional tillage is any tillage system leaving less than 15% residue cover after planting. Reduced tillage is any tillage system leaving 16% – 75% residue cover after planting, excluding no-till, which is any direct seeding system, including site preparation, with minimal site disturbance.
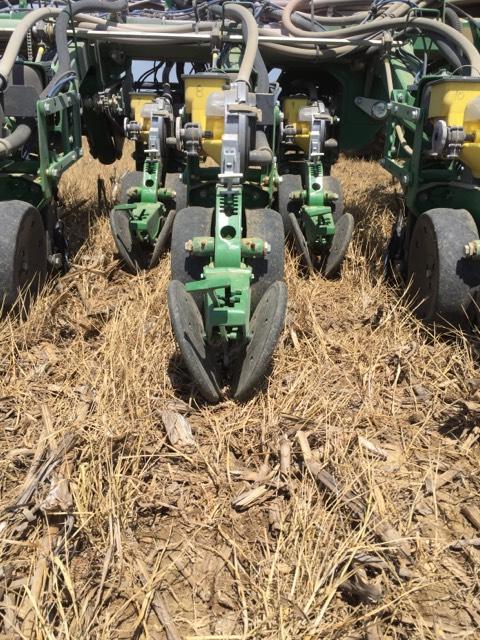
No-till planting system. Note the large amount of plant residue left on the ground.
Photo courtesy of Conservation Cropping Systems Initiative (CCSI).
It is difficult to generalize any tillage usage as either being used any more or less widely across the county over the years because there are such fluctuations in tillage methods. Tillage practices change from year to year for many reasons, including precipitation and soil moisture. However, one can see that generally, the data indicates that soybean fields show a higher rate of no-till practices compared to corn. Between 2021 – 2023, soybeans were not tilled 81% – 93% of the time, versus corn at 24% – 79%. One explanation may be that soybean stubble is easier to plant into versus corn stubble. Corn’s 2022 spring tillage showed a dramatic increase in no-till practices compared to other years; this may be because the fall of 2021 was so wet that it hampered field operations, with producers having a difficult time getting their equipment into the fields to till.
Also, conventional tillage is performed on a very small percentage of corn and soybean fields, as low as 1%, between 2021 – 2023. The variance that occurred in 2023, when 11% of corn fields showed evidence of conventional tillage, could have resulted from the drier fall of 2022, when producers were able to get back into the fields to till after the wetter fall of 2021. When looking at the numbers it is important to keep local conditions in mind. This is the best way to determine whether trends are continued adoption of conservation practices or if trends are more weather dependent and simply a matter of how many working days were suitable for operations like tillage.
Overall, conservation tillage is performed on a considerable percentage of acres in the county. This saves the producer money and wear and tear on equipment by having to take fewer passes across the fields. It also maintains and improves water quality by keeping sediment and nutrients on the fields and out of local water bodies and waterways. This is mutually beneficial to the producer and their land as well as the environment. The SWCD is proud of the efforts of so many producers who are working hard to preserve their soil and water quality for those around them. However, there is still room for continued innovation to decrease tillage systems in corn and still have strong yields, as almost 75% of corn acres are subject to some type of tillage each year.